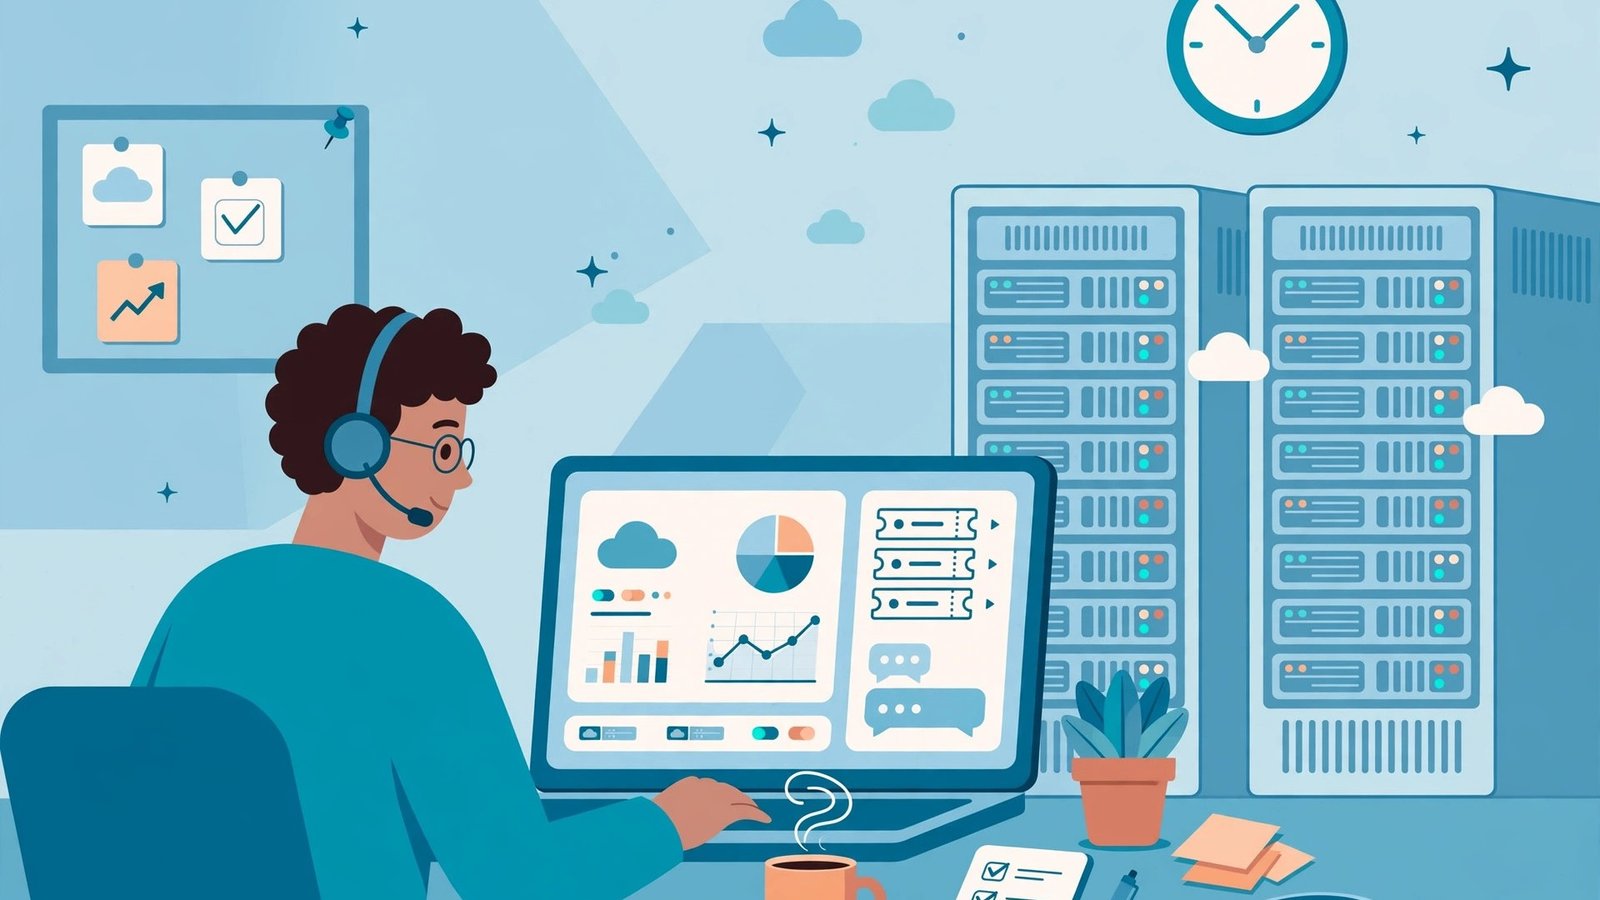
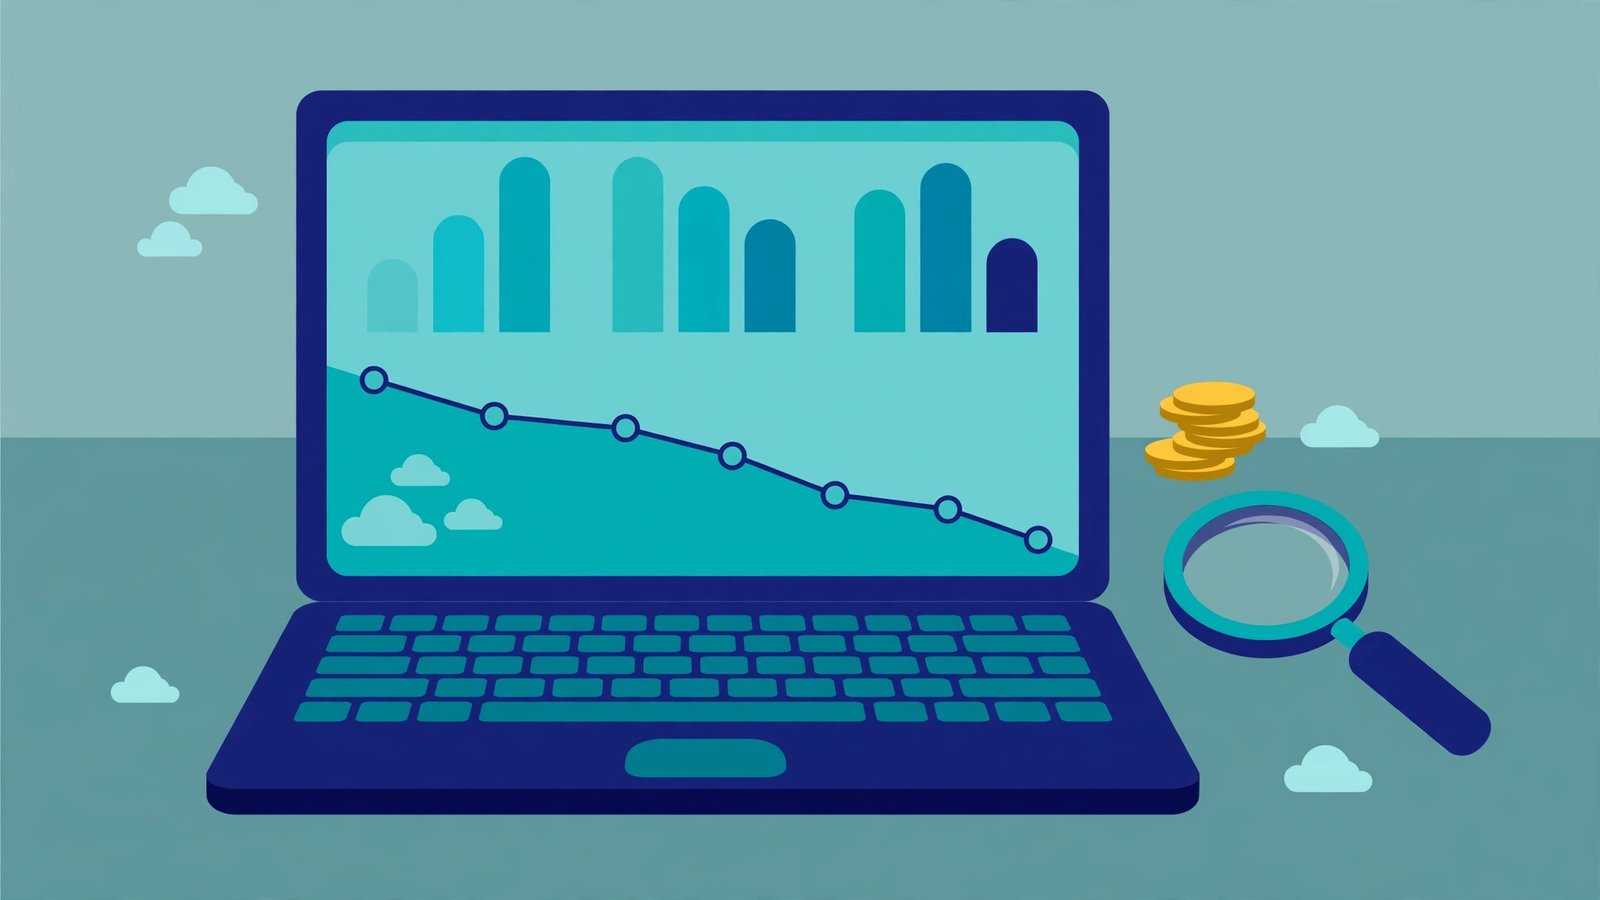

Learning how to monitor cloud costs with free tools is simpler than most teams expect: turn on the cost dashboard your cloud provider already ships for free, group your spending by service and project, and set one budget alert. In under an hour you can go from “we find out at month-end” to a dashboard you glance at every Monday that tells you exactly where the money went.
Why Do Cloud Bills Surprise Small Teams?
The surprise is rarely one huge charge. It is a dozen small ones creeping up quietly: a test database left running over a long weekend, a storage bucket that keeps growing, a load balancer nobody remembers creating. Without a dashboard, nobody notices until the invoice arrives — and by then the money is spent. A budget tells you the limit; a dashboard shows you the trend while you can still change it.
The good news is that you do not need to buy a FinOps platform to get this. AWS, Azure, and Google Cloud each include a free cost dashboard, and for a small team those built-in tools cover almost everything you need. If you are new to watching cloud spend, our guide to what FinOps means for startups explains the habits behind the tooling.
What Does a Good Free Cost Dashboard Show?
Before you build anything, decide what your dashboard must answer at a glance. A good one answers four questions:
- How much have we spent this month, and what will the month-end total likely be? Every provider dashboard shows a month-to-date figure plus a forecast. The forecast is the number that prevents surprises.
- Which service is driving the spend? Compute, storage, databases, and networking behave differently, and each has different fixes.
- Which project or team owns the cost? Without tags or labels, this question is unanswerable.
- What changed since last month? A cost up 40% deserves a look; one up 3% does not.
If your dashboard cannot answer those four, it is decoration. Every setup below is built around them.
How Do I Set Up the AWS Cost Dashboard?
AWS Cost Explorer is free to view (the API costs a small fee per call, but the console views cost nothing). Here is the setup, in order:
- Enable Cost Explorer. In the AWS Billing console, open Cost Explorer and click Enable. Cost data starts appearing within 24 hours; historical data backfills for the past 12 months.
- Create your main view. Group by Service, filter to the current month, and choose a stacked bar chart. Save this as your default view.
- Add a view grouped by tag. If you tag resources by project (for example, Project: website), a second view grouped by that tag ends arguments about which project is expensive.
- Turn on the forecast. Cost Explorer’s forecast line is not perfect, but it is honest about direction. When it crosses your comfort line, act that week, not at month-end.
- Set a budget alert alongside it. A dashboard you never open helps no one. Pair it with an AWS Budget that emails you at 80% of expected spend — see our guide to setting up AWS billing alerts.
A small startup I worked with ran this exact setup and found, in the first week, a forgotten test environment burning $140 a month — more than their entire database bill. The dashboard did not save them money; noticing did, and the dashboard made noticing take five minutes.
How Do I Set Up the Azure Cost Dashboard?
Azure Cost Management is included free with every subscription, and its setup is even shorter:
- Open Cost Management + Billing in the Azure portal and choose Cost analysis. Your current month’s spend appears immediately — no enablement wait.
- Group by Resource group first, then by Service. Resource groups are Azure’s natural project boundary, so this view usually answers “which project costs what” without any tagging work.
- Add a second view grouped by Tag once you tag resources by environment (production vs. test). Test environments are where the waste hides.
- Create a budget with an alert. In Cost Management, set a monthly budget for each resource group and an alert at 80% and 100%. Azure can email a whole team, not just one person — use that, so alerts survive holidays.
- Check the Advisor recommendations tab. Azure Advisor lists concrete savings — idle virtual machines, unattached disks — with estimated monthly savings beside each. Work through the top three each month.
What About Google Cloud’s Free Billing Dashboard?
Google Cloud’s Billing Reports, in the Cloud Console under Billing, is free and needs no setup beyond having a billing account:
- Open Billing Reports and view the current month grouped by Service, then grouped by Project — GCP’s project boundary is usually the cleanest way to split costs.
- Turn on Budgets & alerts for each project, with a threshold at 80% of expected spend. Alerts can go to email or Pub/Sub, which you can route to Slack.
- Use labels the way AWS uses tags. A label like env:staging makes the grouped-by-label report genuinely useful. Unlabelled resources all land in one bucket labelled “no label,” which tells you nothing.
If you run more than one cloud, do not try to merge them into one dashboard at this stage. Keep one dashboard per provider and review them in the same weekly session — that solves the same problem for a small team without a paid tool.
How Do I Build a Weekly Cost Routine Around These Dashboards?
Tools do not save money; routines do. Here is the 15-minute weekly routine that makes the dashboards work:
- Monday, 15 minutes: Open each provider’s dashboard. Note month-to-date spend, the forecast, and the top three services. Is anything up more than 20% on last week?
- Investigate one spike. Trace the largest unexplained increase to its service, project, and resource. Most spikes have a boring cause — a forgotten test, a misconfigured backup — and a five-minute fix.
- Act on one recommendation. Take the top item from Azure Advisor, Cost Explorer’s rightsizing recommendations, or GCP’s Recommender and do it. One fix a week compounds fast.
- Friday, two minutes: Confirm the budget alerts are still on and the alert list still includes whoever is on call. Alerts that go to someone who left are the same as no alerts.
After a month of this routine, you will know your normal spend pattern by heart — and that is the real goal, because then abnormal jumps out at you.
What Mistakes Should You Avoid?
First, do not skip tagging. An untagged bill is a mystery, not a report; agree on three tags — project, environment, owner — and apply them to everything new. Second, do not check the dashboard daily and react to noise; weekly trends are what matter. Third, do not buy a paid FinOps tool until the free dashboards stop answering your questions — most small teams never reach that point. And fourth, do not forget anomaly detection: a dashboard shows the trend, but an alert catches the spike while you are on holiday. Our guide to cloud cost anomaly detection shows how to switch it on in all three clouds.
Frequently Asked Questions
Are AWS Cost Explorer, Azure Cost Management, and GCP Billing Reports really free?
Yes, the console dashboards and standard reports are free on all three providers. AWS charges a small fee only if you query the Cost Explorer API programmatically; viewing charts in the console costs nothing.
How long does it take to set up a free cloud cost dashboard?
About 15 minutes per provider, plus up to 24 hours for AWS Cost Explorer to populate its first data. Azure and Google Cloud show current-month data immediately.
Do I need to tag my resources for the dashboard to work?
No, the dashboard works without tags — but without them you can only see costs by service, not by project or team. Three simple tags (project, environment, owner) turn a generic chart into a report that tells you who should act on each cost.
When should a team move from free tools to a paid FinOps platform?
When the free dashboards stop answering your questions — typically when you run multiple clouds with shared costs that must be split by customer or product, or when finance needs chargeback reports the provider consoles cannot produce.